


Table of Contents
Spotting the crypto market bottom (the lowest point in price) is easier said than done. The same goes for timing the market properly, selling at the top, and getting the most out of your initial investment. That’s why trend reversals and switches from bear markets to bull markets are such a big deal.
Traders who can capture them accurately can significantly grow their portfolios. How can you make it to the top 5% of traders and precisely identify and trade trend reversals? Here’s how!
Signs of a Reversal
VIX Index Top
The Fear and Greed index is a stock market bottom indicator that takes several factors into account, such as market volatility, price momentum, strength, and breadth, just to name a few.
The relationship between the Standard and Poor (S&P 500) and the Fear index is inverse. In other words – the higher the fear level is, the closer the trend reversal on the stock market.
The climax of the VIX index is an early sign of the bottom and, typically, announces trend reversal and switching from a bear market to a bull rally.
Talking about the crypto market, we can use another version of the Fear and Greed index – the BitVol index. It is a real-time index that tracks the volatility of Bitcoin’s price on a specific day in US dollars.
As already explained, once the crypto market’s fear index tops, this kind of scenario potentially introduces the upcoming bull market.
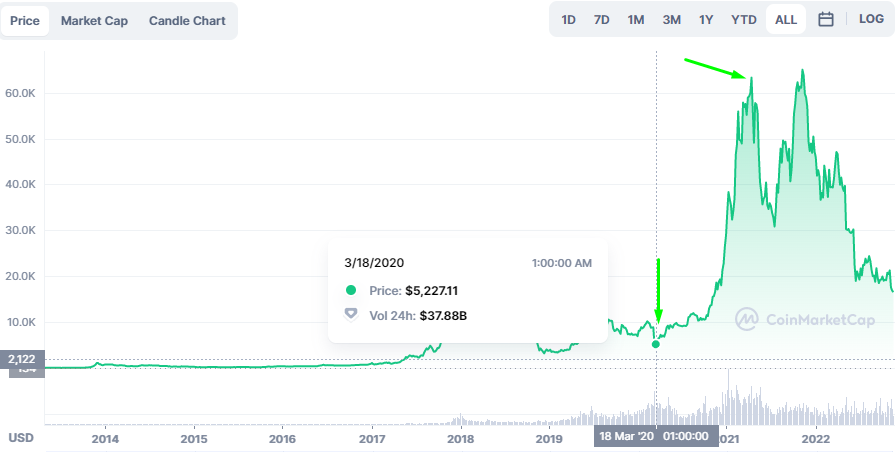
The highest BitVol index ever measured was 190.28. After an event of extreme fear in the market that occurred in March 2020, the prices of cryptocurrencies started recovering and almost reached the ATH within a year.
Spreading FUD
Most crypto traders and investors have a so-called herd mentality. They make decisions based on what social media influencers say and sometimes buy and sell purely by following their instinct.
These retail peeps entirely ignore technical analysis and charts and make moves almost without thinking, which is also why they lose money most of the time.
And then, there are contrarians, traders who couldn’t care less about doom and gloom prophets who make predictions that the stock market is about to crash or that Bitcoin is heading to zero, spreading FUD in the process (fear and doubt). FUD strategists do their best to drive the price even lower and pressurize investors to sell at a loss.
Contrarians’ slogan is – buy when others are fearful, sell when others are greedy. Unlike an average trader, a contrarian pays close attention to technical signals that help them predict a new trend and indicate the best moment for a buy-in.
At a certain point, fear starts dissipating, price consolidating, and the market slowly bottoming out. In the meantime, contrarians have amassed a lot of coins while the others are left bagless.
A new, fresh wave of crypto enthusiasts enters the market, starts buying, and drives the volume and price up, which is a sign of the very beginning of the next bull run.
No matter if you want to trade on the stock, forex, or crypto market, do your best to cut through the noise and listen to no one’s investment advice — especially not the one coming from the street — and get the hang of the best trading techniques.
Price Divergence
Cryptocurrencies fall into different categories – stablecoins (USDT, USDC), privacy coins (XMR), exchange-based coins (UNI), etc. The same goes for stocks, so we have small, mid, and large-cap stocks, domestic and international, domestic stocks, and so on.
Coins or stocks from the same category typically move synchronously – in the same direction, while coins from different sectors don’t necessarily move in tandem.
These kinds of price divergences (when one of the currencies is creating higher lows and higher highs, while the other one is creating higher lows) can announce the long-awaited bottoming out and the start of a new bull run.
Let’s take Bitcoin and Ethereum, coins that fall into different categories, as examples.
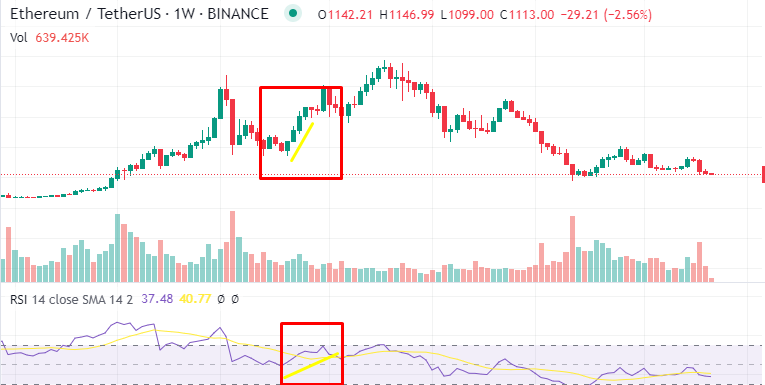
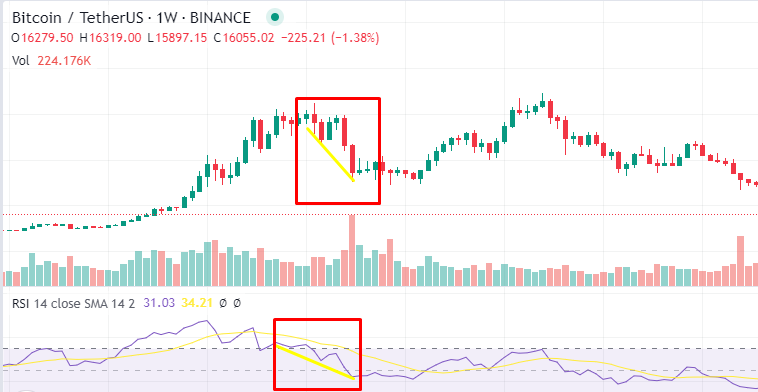
You can clearly see that price divergence can be used as a trend reverse signal.
Trend Reversal Patterns
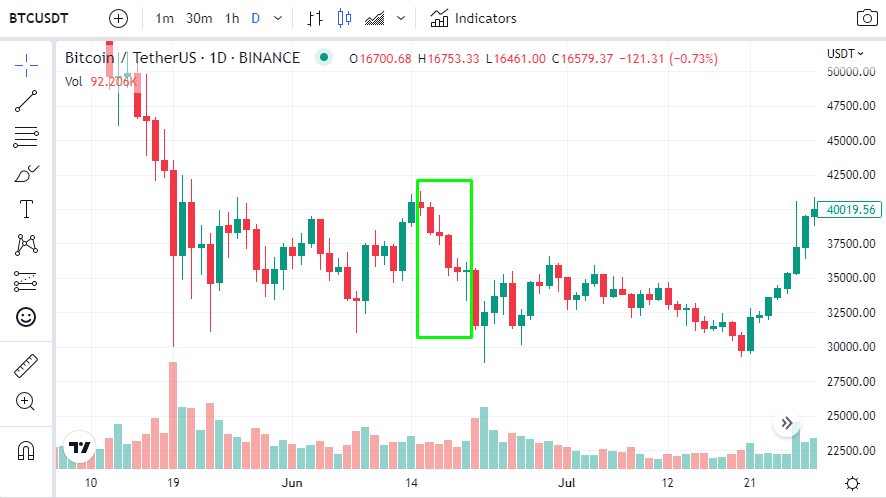
5-Bar Pattern
As you can guess by its name already, this pattern potentially announces a trend reversal followed either by closing five bullish or five bearish candlesticks in a row. However, it doesn’t necessarily mean that the trend would be broken just because a chart registers five consecutive bars.
Wait only until the 6th candle starts forming. If you can spot five bearish candles on the chart, enter a trade only and only if the 6th one turns out to be green and surpasses the 5th candle.
If, after forming five bearish candles, the 6th candle starts turning green but still doesn’t get larger than the 5th one, that is not a sign of a trend reversal (see below).
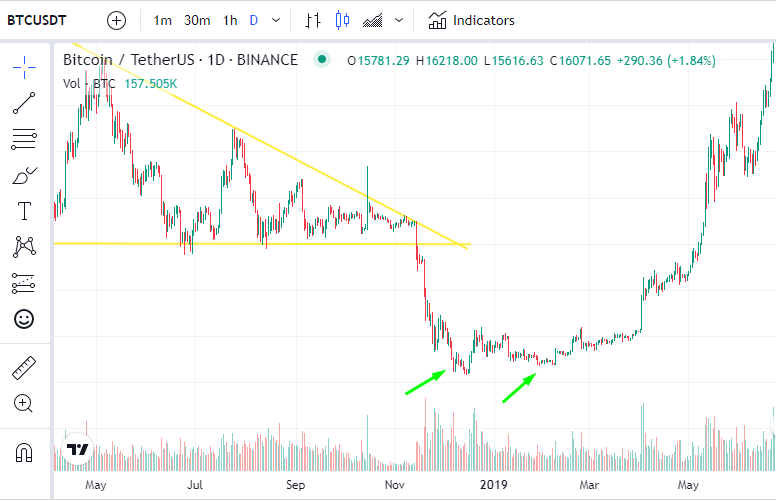
Double Bottom
Contrary to the double top, the double bottom predicts a bullish price movement and is one of the most reliable reversal signals.
You’ll recognize it by the “W” shape since the price forms two lows while the peak is in the middle. If the price manages to get above the peak at the second attempt and rises above the neckline, this indicates a new bull run.
We, again, used Bitcoin as an example, although you can apply this pattern for any asset class you are trading. After a long period of price consolidation, followed by a major drop of more than 60%, the price created a double bottom and skyrocketed from there.
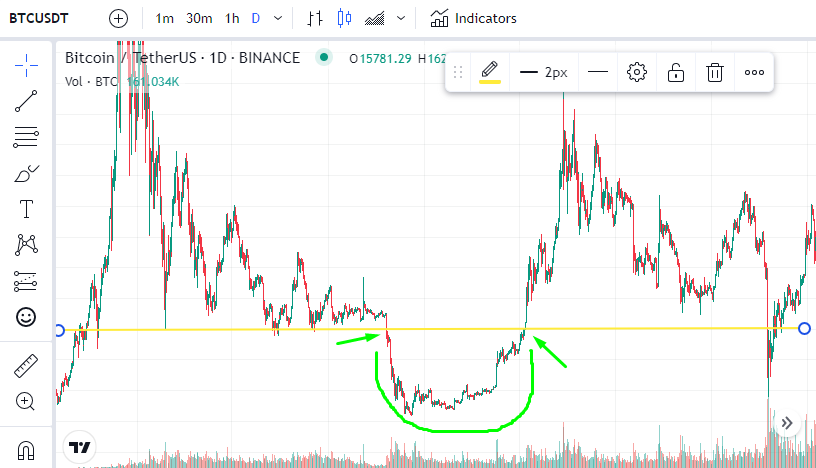
Rounded Bottom
The rounded bottom formation or a saucer bottom is another bullish trend reversal pattern. You can recognize it as easily as the double bottom pattern since it looks like the “U” letter.
In the example below, you can see this yellow-marked area served as support for a while. Once the price flopped below the support, it took months to create the rounded bottom, which is why we always suggest using higher time frames for identifying bullish trend reversals.
Once the rounded bottom was formed, the price tested the support line once again and finally sliced through it with ease.
Intraday Reversal
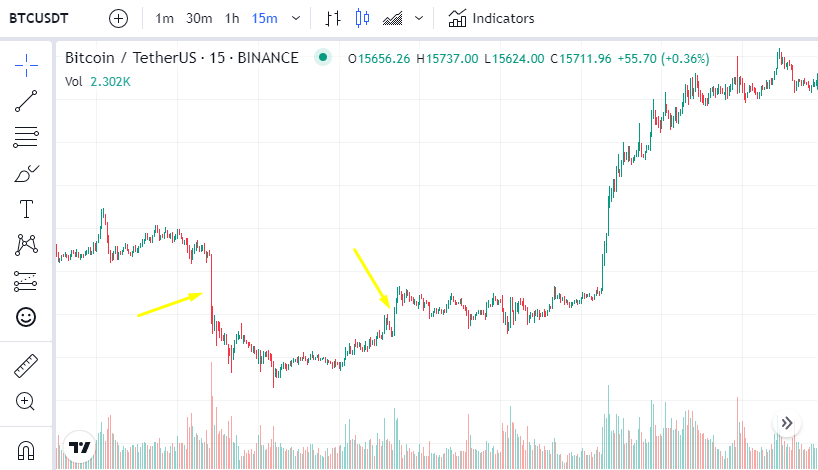
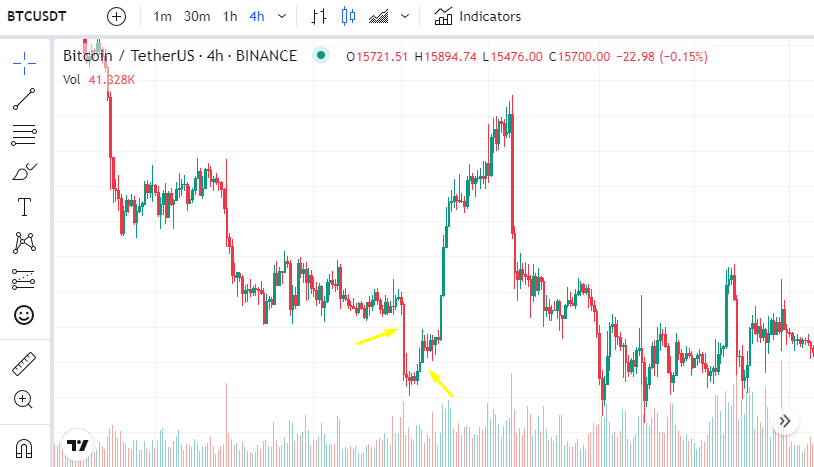
Intraday reversals can signal that the market is almost ready to hit bottom. These are simple to spot since they occur after major downside price movements on a daily basis. Even after a huge sell-off event, buyers can step in and gain control over the market within the same day.
Stick to lower time-frame charts such as 15 minutes (see below), but then, zoom out and check if the pattern is spreading on the higher time frames, too.
Still, do not take intraday reversals as the sole sign of reversal since it doesn’t carry a lot of weight. Instead, use technical indicators such as MACD and RSI as well to confirm the bottom and increase your chances of entering a winning trade.
Trend Reversal Indicators
Support and Resistance Reversals
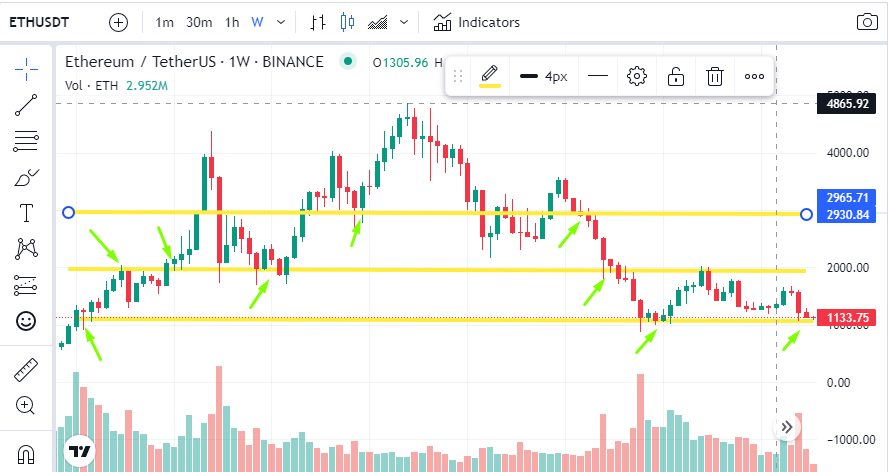
When defining support and resistance levels, traders look at the higher time frames. In this example, we can see that a certain level can act as both support and resistance. The more times a support line gets tested, the higher the chance of breaking it.
However, successfully breaking through the resistance zone on a higher time frame chart typically announces a trend reversal and a massive price movement to the upside.
That’s how ETH bounced from the $1,100 resistance level to $1,950, then kind of retested the resistance that turned into support, and went up to $3,000 first and then to $4,865, its all-time high.
The opposite rules apply to trend reversal to the downside. If a token starts retesting and breaking all major support levels, that announces a major price drop.
Huge Volatility
Although crypto is quite a volatile market, sometimes, volatility is off to the races! Many experienced traders take extreme market volatility to the upside and downside in a single day (going up and down for several thousands of dollars) as one of the most reliable trend reversal indicators.
Take a look at this chart. Although the selling pressure for Bitcoin was pretty high, which you can tell by the volume spikes marked with red, the buying pressure was higher. The coin successfully broke above resistance and continued the uptrend movement.
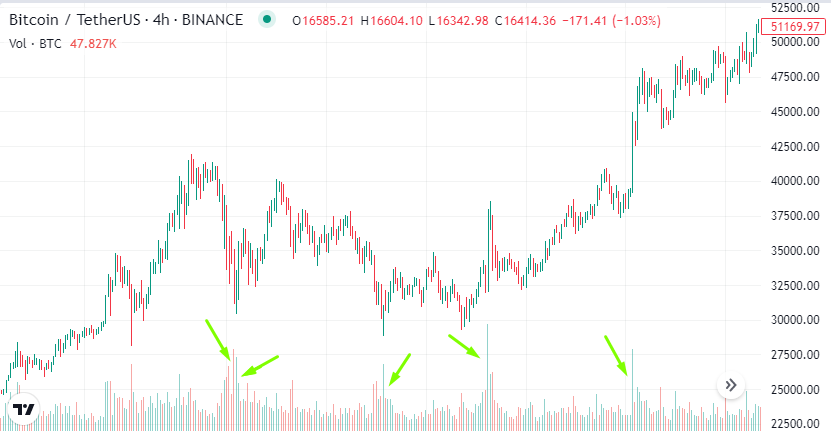
However, beware that this kind of battle between bears and bulls doesn’t necessarily mean that the market will recover and turn green. Keep an eye on other signs and patterns we’ve mentioned throughout the article to get multiple confirmations of a trend reversal.
Breaking the Trend Line
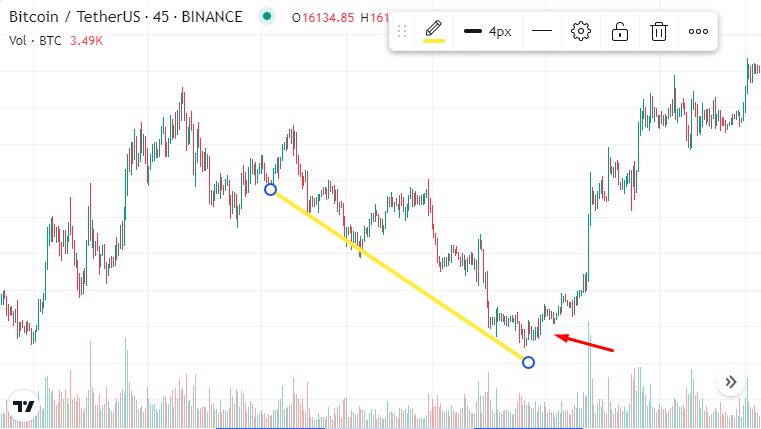
When a stock or cryptocurrency has been trading at certain prices for a longer time, we can clearly pull a trend line – either to the upside or to the downside. The trend line can act as both support and resistance.
In this example, we can see Bitcoin creating a downward trend line that acts as a support. Finally, at one point, the coin stopped creating lower lows, broke above the trendline, and marked a new, bullish phase.
Summary
Knowing how to perform technical analysis can help anyone make their trades more profitable, regardless of the market and assets they are trading. However, it’s also important to note that you should never rely on a single indicator blindly. Instead, zoom the charts in and out and wait for multiple bullish confirmations on both lower and higher time frames before making any trading decisions.
Crypto Ping Pong Digest
Trash style news. You will definitely like